Central Ohio Real Estate Year End Review
- Brandon Alfriend
- Feb 28, 2018
- 6 min read
The 2017 real estate market in Central Ohio was insane. Prices shot through the roof and homes in hot areas often sold in a matter of hours. This is what people in the housing industry call a "seller's market". In short, it was a good year to sell, and a bad year to buy a house.
In this post, I'm going to sum up what happened in 2017, and provide my take on why it went down this way. If you're just looking for a highlight reel, I included a quick data summary below outlining the key housing metrics I like to look at. But if you're seeking in-depth real estate analysis packed full of more charts, statistics, and economic data, then read on!
Bonus: Check out my recent post outlining my 5 bold predictions for the Columbus real estate market in 2018!
Data Summary
(for busy people who don't like to read)


In-Depth Analysis of the 2017 Real Estate Market in Columbus
Okay, so if you're seeking more info than the charts shown above, then keep reading. As an avid history buff, I'm a huge proponent of the "history repeats itself" mantra. There are certainly a ton of lessons to learned from the past that will help us better understand the present and prepare for the future. Here we go!
Number of Homes Sold
First things first, I'd like to clarify what I'm referring to when I mention home sales. For purposes of this study, we're looking specifically at all residential properties sold in the Columbus Metropolitan Area. This primarily includes single-family homes and condos, but also a handful of duplexes and multi-unit apartment buildings. With that said, home sales have been steadily increasing over the past 7 years, maxing out at 32,218 in 2017.
But despite setting a new record last year, the number of homes sold in 2017 is slightly lower than what one would expect in a "balanced" market. To estimate how many homes should sell per year, I look at the following variables:
Population of Columbus Metro Area: 2,021,632
Average Household Size: 2.3 people
Average Length of Time in a Home: 11 years
Homeowners versus Renters: 44.9% own
Population Growth Rate: 1.36%
Here's the math: 2,021,632 / 2.3 / 11 x 44.9% x 101.36% = 36,366 homes sold
Based on this, 36,366 homes should have sold in 2017. So we missed the target by about 10% - does this really matter? Well, yes and no. This data only quantifies what we already know - there's a housing shortage in Columbus. Remember the seller's market I mentioned in the first paragraph? This is it. Based on local demographics, over 36,000 homes should have sold last year, but only 32,000 actually sold. The simple reason why is that there weren't enough homes available to purchase.
Key Takeaways: More homes sold in 2017 than any other year ever, but this was still 10% short of the number of home sales expected. This is a sign that the housing supply can't keep up with the growing demand, which should lead to higher home prices in the future.
Number of Homes Listed
While the number of homes sold each year is steadily rising, the number of homes available to purchase has remained relatively flat. Noticing a trend yet?
To put this in perspective, the ratio of homes sold to homes listed exploded from 65% in 2011 to 87 in 2017. That's a big difference! New development is helping to alleviate the housing shortage, but thus far, builders have been unable to keep up with the growing demand.

According to the Department of Housing and Urban Development, the number of new homes permitted in Central Ohio actually hit an all-time low in 2016 (see chart to the right). If this housing shortage is ever going to end, this trend will need to reverse course soon.
Key Takeaways: The number of homes for sale has remained relatively flat, despite population growth in Columbus. This is a key contributor to the housing shortage, and a sign that home prices will remain high for the immediate future.
Average Sale Prices
There are three main ways to analyze the average home sale price. First, is simply taking the average of all homes sold. Based on this analysis, home prices have steadily increased by 5.4% per year since 2011, and peaking at a whopping $215,000 last year...not bad!

But an even better way to measure sale price is average price per square foot. Since bigger homes are typically more expensive, and home sizes fluctuate over time, this is a great indicator of the true change in home values. This is been increasing at rate of 6.4% per year since 2011.

The final, and perhaps most unique, way to measure home prices is through the sale price to list price ratio. The blue line on this chart indicates the sale price as a percent of the original list price, and the gray line indicates the sale price as a percent of the final list price. Since most sellers lower the asking price of their home at least once, there is a slight difference in these numbers.
There are two noteworthy trends here that show the Columbus real estate market is on the rise. First, and most obvious, is that the percentages are rising. The sale price to original list price has actually increased from 89.5% in 2011 to 97.1% last year. This is huge! Second, the gap the two trend lines is narrowing, which shows that price drops are becoming smaller and less frequent.
Key Takeaways: Home prices rose by about 6% from 2016 to 2017, setting the record for the highest average sale price at about $214,802. Further, the average homeowner is selling just 2.9% below their original asking price, versus 10.5% in 2011.
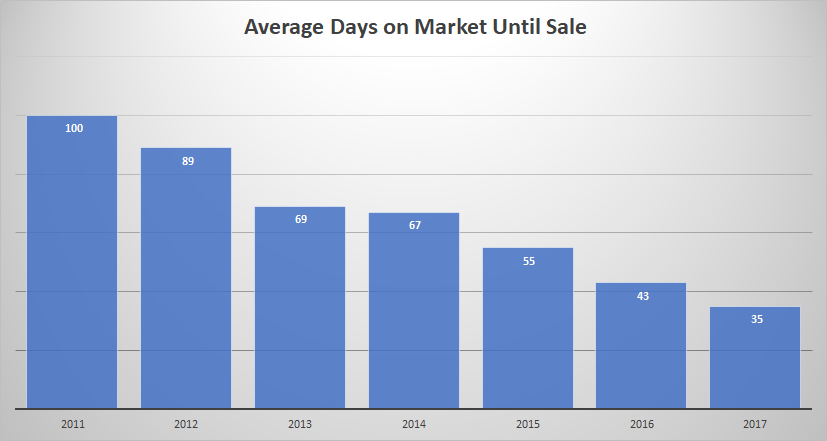
Average Days on Market
Days on market is one of the most underrated real estate metrics we have available, and simply refers to the amount of time it takes to sell your home. This number has dropped significantly since 2011, bottoming out at just 35 days in 2017. And in some areas, such as Clintonville, Worthington, Hilliard, and Gahanna, homes are selling in 26 days or less! This is yet another sign that there are more buyers than sellers in Central Ohio.
Key Takeaways: Homes are selling faster. If you're planning to buy a house this year, be ready to make quick (but wise) decisions so you don't miss out on your dream home.
The Causes
Ok, so we know that 2017 was a great time to sell, and a not so great time to buy. But, what in the world caused this epic seller's market? Perhaps we're just reaping the benefits of mighty macroeconomic forces, such as a strong US Dollar or a booming stock market. Or dare I say the Central Ohio real estate market is being shaped by larger geopolitical forces...i.e. Brexit, the decline of ISIS, or even the Catalans valiant, but failed attempt at independence from Spain. These are just a few explanations I've heard, and unfortunately they're probably all wrong.
In reality, the real estate market in Columbus is thriving for 2 main reasons: population growth and low interest rates.
First, let's look at population growth. It's obvious that Central Ohio is growing. Just drive around downtown Columbus, Ohio State's campus, or the Bridge Street District in Dublin and you'll see what I'm talking about. In fact, the Columbus Metropolitan Area recently breached the two million mark, making it the 14th largest city in the nation. Believe it or not, Columbus is bigger than cities like Seattle, Denver, Boston, Washington DC, and Nashville!
As one of the most stable towns in the Midwest, Columbus has been a magnet for many people in surrounding areas, such as Cleveland, Pittsburgh, and West Virginia. The state capital, Ohio State University, and a laundry list of large corporations make Central Ohio a very attractive place to live, and I think this trend will continue indefinitely.
In fact, The Mid-Ohio Regional Planning Commission estimates further growth of 500,000 to 1,000,000 over the next 30 years. If this estimate holds true, we could see over 80 people moving here every single day!
The second main cause of the 2017 boom market was historically low interest rates, which stayed below 4% for most of the year. Lower interest rates lead to lower monthly mortgage payments, which, for all intensive purposes, makes homes more affordable. The graph below shows how the monthly mortgage payment on a $200,000 home is impacted by various interest rates.

As homes become more "affordable" due to low interest rates, the demand for real estate increases. This increase in demand subsequently breaks the equilibrium with supply, and suddenly we have a seller's market. Notice a trend? Over time, this leads to a rise in home prices, and this is precisely what we saw in 2017.
But unfortunately, it looks like the days of 4% rates may be coming to an end soon. I highlight this idea in my last blog post, 5 Bold Predictions for 2018.
Final Thoughts
Last year's real estate market was crazy! Homes were selling faster and for more money than ever before...there were simply more buyers than sellers. This is primarily due to a growing population in Central Ohio and historically low interest rates.
But all sellers markets must eventually come to an end. As we saw in 2008, what goes up must come down. The economy in Columbus is booming, but interest rates are on the rise and the stock market is becoming more volatile. I am therefore proceeding into 2018 with cautious optimism and hoping for the best.


Comments